How Headless Chrome Almost Took Down Our Production
Sahil is a full-stack software engineer with expertise in both front-end and back-end development. His experience encompasses diverse projects, including SaaS solutions and custom systems.
It is not what you are thinking…
Around 3 AM on a Saturday, my phone started buzzing with alert notifications. Our metrics cron job was failing & couldn't push data to Observability DB. This is a legacy script that runs every 5 minutes, greps through logs for certain patterns, counts them, and sends the numbers to our time-series database. Not exactly mission-critical stuff.
I checked the cloud status page. Network maintenance was scheduled in the region and was ongoing. "That's probably it," I thought. Some VPC connectivity issues, packets getting dropped somewhere in the backbone. We were still getting most of our readings except missing one every 3 or 4 cycles. I figured we'd look into it Monday since it was not extremely critical, probably a network related small issue that might resolve on its own.
That was a mistake.
More Alerts
About an hour later, more alerts started coming in. Different service this time! Our real-time notification service (let's call it Service A). It kept restarting every 30 minutes.
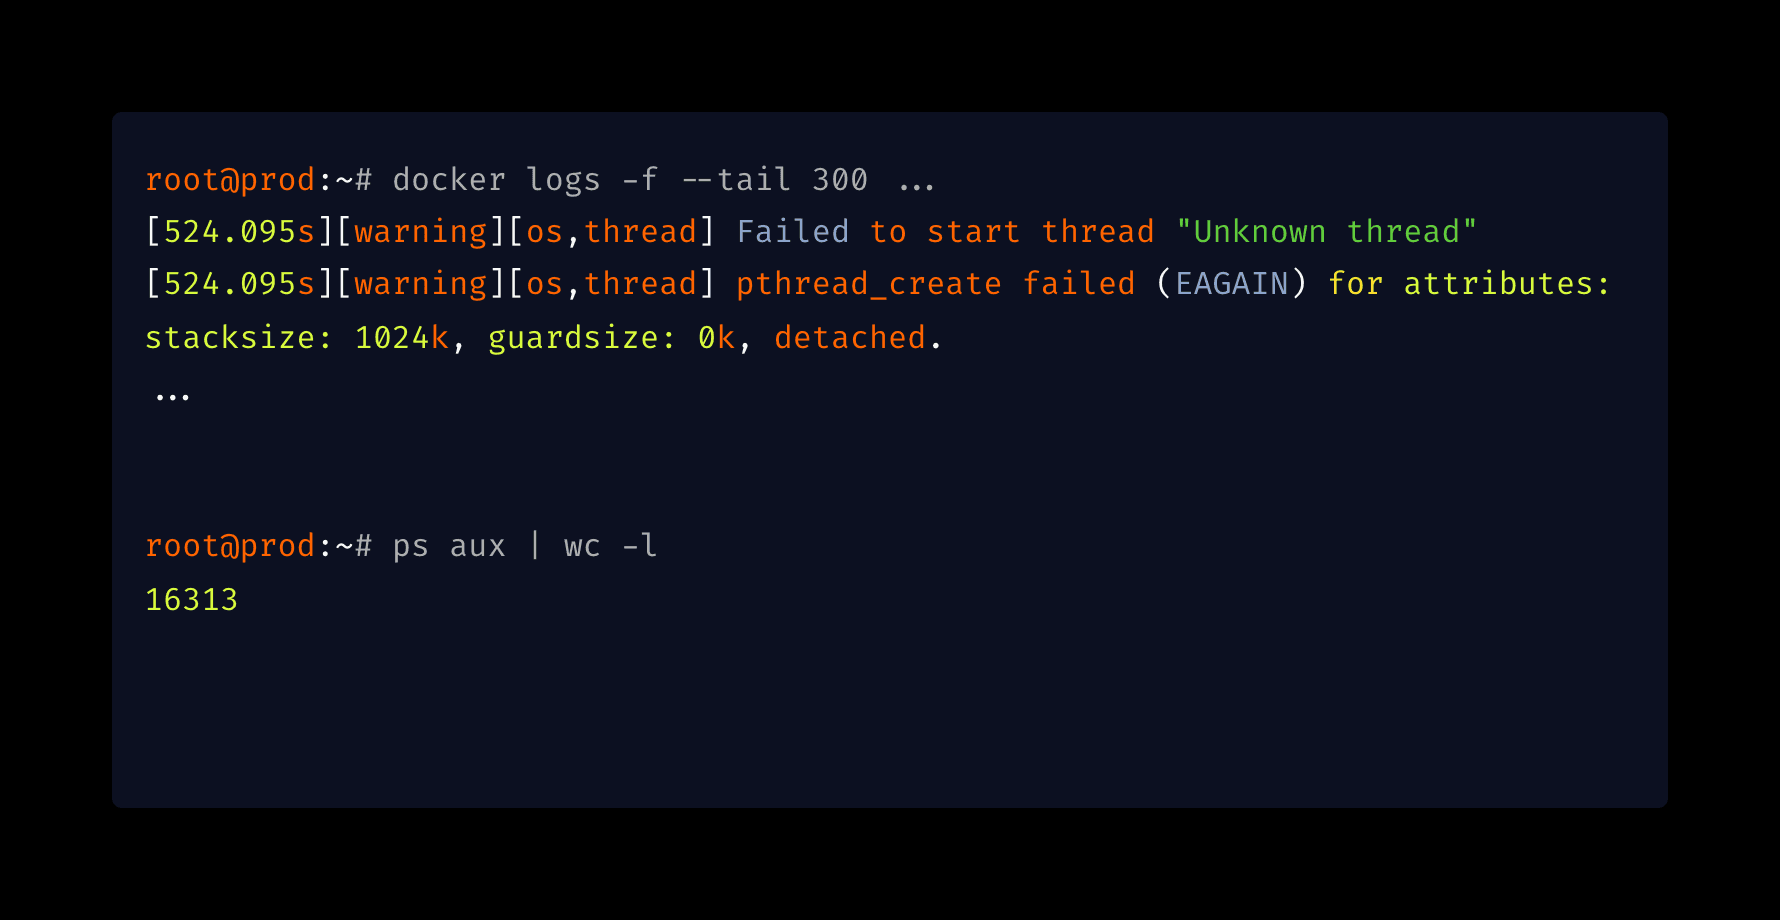
Service A has health checks that trigger restarts when something goes wrong. It wasn't dying completely, just stuck in this restart loop. The logs were showing something I hadn't seen before:
[warning][os,thread] Failed to start thread "Unknown thread" - pthread_create failed (EAGAIN)
java.lang.OutOfMemoryError: unable to create native thread: possibly out of memory or process/resource limits reached
Now, when a Spring Boot app crashes, you usually expect something like OutOfMemoryError: Java heap space. Maybe the scheduler crashed. Maybe some corrupt data got into a loop. Normal stuff.
I pulled up the dashboards. RAM usage: 40%. Heap: healthy. CPU: under 50%.
So what was going on?
That EAGAIN error was the clue. In the Linux man pages for pthread_create, EAGAIN doesn't mean you're out of RAM. It means:
"The system lacked the necessary resources to create another thread, or the system-imposed limit on the total number of threads would be exceeded."
The OS wasn't out of memory. It was out of process slots.
16,313 Processes
I SSHed into the production VM. The system felt a bit sluggish, which makes sense now, since SSH itself needs to spawn threads to work. But top showed low CPU load and plenty of free memory.
I ran a simple process count:
root@prod:~# ps aux | wc -l
16313
16,313 processes. This server normally runs about 300.
I ran ps aux to see what was eating up all those slots:
root@prod:~# ps aux
...
Thousands of identical lines:
chrome --headless --disable-gpu --no-sandbox ...
chrome --headless --disable-gpu --no-sandbox ...
chrome --headless --disable-gpu --no-sandbox ...
16,000 instances of Headless Chrome. Sitting there. Doing nothing. 0% CPU. Just... existing.
Tracing it Back
I knew which service used Chrome. We have a legacy report generation service that uses Selenium with Headless Chrome to render PDFs.
I opened the code and found the problem immediately. It was in the finally block:
  import org.openqa.selenium.chrome.ChromeDriver;

  public String headlessChromeDriverProcess(...)
  {
    WebDriver driver = null;

    try {
      driver = new ChromeDriver();
    } catch (Exception theException) {
      ...
    } finally {
      if (driver != null)
        driver.close();
    }

    return ...;
  }
Here's the thing about Selenium that I guess might have caught a lot of people off-guard:
driver.close() closes the current browser tab. That's it. The chromedriver binary keeps running. The Chrome process keeps running.
driver.quit() closes everything and actually kills the OS process.
To double-check, I opened documentation and it made it pretty clear:

Sounds similar, right? But the implementation is completely different. Look at where these methods come from:

See that? quit is inherited from ChromiumDriver. close is inherited from RemoteWebDriver.
RemoteWebDriver is most probably a generic class. It is designed to talk to browsers running anywhere, potentially on remote machines over HTTP. It doesn't know there's a local chromedriver executable running on your machine. It just sends a command to close a tab.
But ChromiumDriver overrides quit() specifically because the authors knew that it requires local cleanup. It probably calls something similar to stopService(), which sends the kill signal to the actual OS process.
By using close(), we were hanging up the phone but leaving the line connected. Every report generated = one orphaned Chrome process. Over weeks and months, we accumulated 16,000 of them.
Why Did the Other Service Crash?
This is the part that confused me the most at first. Service A had nothing to do with Chrome. Why did it crash?
The server has 64GB of RAM. It can handle 16,000 idle processes. Why couldn't Linux spawn one new thread?
I checked the kernel limit:
root@prod:~# cat /proc/sys/kernel/pid_max
32768
32,768. That's the hard ceiling. Linux cannot assign a Process ID higher than this number. This VM has been running for almost 10 years, so the legacy default made sense.
But hold on. 16,000 Chrome processes. That's half of 32,768. We should have plenty of room left.
After searching, I learned how Linux actually works. Threads aren't separate from processes, they're "Lightweight Processes" (LWP). To the kernel, a thread and a process are basically the same thing represented by task_struct. They both need a unique ID from the same pid_max pool.
I ran the command that shows the real picture:
# This shows processes only
root@prod:~# ps -e | wc -l
291

# This shows threads + processes (the real load)
root@prod:~# ps -eLf | wc -l
1457
With a clean system right now, we have 291 processes but 1,457 threads. That's a 5x multiplier.
Our Java services are heavily multi-threaded; each one spawns 500+ threads. During the incident, the math was:
16,000 zombie Chrome processes
~15,000 active Java threads across all services
System processes
That's around 32,000 IDs consumed. Right at the edge of our 32,768 limit.
That Explains the Cron Job
This also explained the intermittent cron failures from earlier.
Our monitoring script ran a pipeline like:
grep "PATTERN" /var/log/service.log | wc -l | curl -X POST ...
In Linux, pipes spawn multiple processes simultaneously. This script needed 3 or 4 PIDs just to run.
When we had enough free slots: script ran fine. When we had few free slots: kernel returns EAGAIN, script dies.
It wasn't a network issue.
The Fix
1. The Code Fix
Changed close() to quit():
finally {
    if (driver != null) {
        try {
            driver.quit();
        } catch (Exception e) {
            logger.warn("Failed to quit driver: " + e.getMessage());
        }
    }
}
2. Monitoring
I considered bumping pid_max to 4 million but honestly, we don't need that many processes. The real problem was we had zero visibility into process counts.
I added metrics for process and thread usage at the host level. Next time this starts creeping up, we'll know before it becomes a problem.
My Personal Takeaways
We spend a lot of time watching CPU and memory graphs. But process IDs are a finite resource too, and they don't show up on your typical dashboard. Threads draw from the same PID pool. ps aux only shows you part of the picture. Use ps -eLf to see the real load.
close() vs quit() in Selenium: They sound similar, but quit() is the one that actually kills the OS process. Always use quit() in your cleanup.
Legacy defaults can bite you, in the early morning sometimes. A pid_max of 32,768 was fine 10 years ago. Modern multi-threaded applications can blow through that.
We were lucky to catch this before it cascaded to the database; that would have been catastrophic.
Next time you see random EAGAIN errors, check your process table. You might have sleeping zombies…
# The quick check
ps aux | wc -l

# The real check
ps -eLf | wc -l